
Sales Pipeline Analysis: Why Your Pipeline Numbers Are Lying and How to Fix Them
Your pipeline report says you are on track. But your quarter closes short. Every time. This is not a forecasting problem. It is a sales pipeline analysis problem. The numbers in your CRM are not wrong because something unexpected happened. They are wrong because the data behind them was never accurate in the first place.
Sales pipeline analysis is the practice of examining how deals actually move through your sales process, measuring the metrics that reflect pipeline health, and building a forecast from verified evidence rather than rep-reported stage updates. When it is done correctly, your pipeline report tells the truth. When it is skipped or done superficially, your pipeline looks full right up until the quarter falls short.
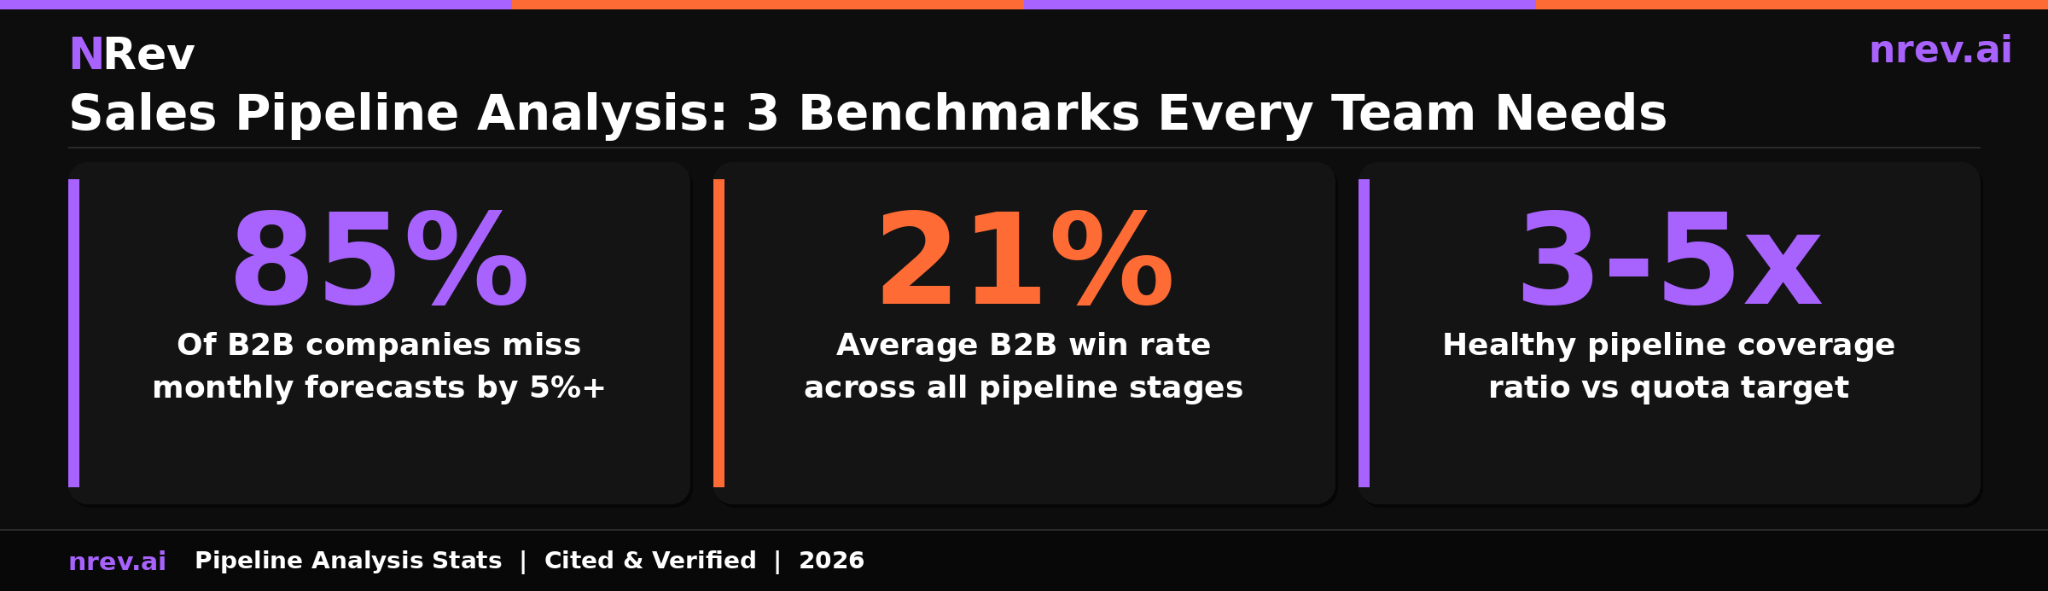
According to a Forrester Consulting study commissioned by Clari, 85 percent of B2B companies miss their monthly sales forecast by more than 5 percent, and 51 percent miss by more than 10 percent. Root source: Forrester Consulting, survey of over 300 software industry revenue operations decision-makers. This is not a rounding error. It is a systemic failure in how most teams conduct pipeline analytics.
This guide covers exactly why pipeline numbers lie, the six sales pipeline metrics that reveal the truth, how to calculate pipeline conversion rate at each stage, what healthy sales pipeline health looks like, and how to build a pipeline analysis rhythm your team can actually act on.

Why Most Sales Pipelines Are Built on Fiction
The problem with most sales pipeline analysis is that it starts from the wrong input. It takes whatever stage and probability data is in the CRM, multiplies by deal value, and presents the result as a forecast. This approach has a critical flaw: the underlying data is built from rep self-reports, which are subject to optimism bias, inconsistent stage criteria, and political pressure to maintain the appearance of a healthy pipeline.
When a rep moves a deal to "Proposal Sent" stage, that action triggers a pipeline calculation. But what if no proposal was actually sent? What if the deal stage has not been updated in six weeks? What if the contact the rep has been working with left the company last month? The CRM will still show that deal at full value in the appropriate stage, contributing to a forecast that leadership is making real decisions from.
This is not a technology problem. It is a behavior problem with a data integrity consequence. The solution is not a better dashboard. It is a more rigorous approach to what counts as verified pipeline progress and what metrics tell you the truth about pipeline health regardless of what stage a rep has manually entered.
The Three Ways Pipeline Numbers Lie
Before covering what metrics to track, it helps to understand the specific mechanisms by which pipeline numbers lose accuracy. There are three distinct failure modes, and most B2B sales teams experience all three simultaneously.
Lie 1: Stage Inflation
Stage inflation happens when deals are moved forward in the pipeline based on rep activity rather than verified buyer behavior. A rep sends an email proposing a call and moves the deal to "Discovery Scheduled." The call never happens. Three weeks later, the deal is still in Discovery Scheduled at full value, contributing to a pipeline report that overstates how far along the deal actually is.
The fix for stage inflation is defining stage exits based on buyer-confirmed actions rather than seller-initiated activities. Discovery is complete not when a rep has sent an outreach but when a buyer has participated in a discovery call and confirmed a next step. Proposal stage begins not when a rep has drafted a proposal but when a buyer has explicitly asked for one and confirmed they will review it. Stage criteria tied to buyer actions produce dramatically more accurate pipeline data than criteria tied to rep actions.
Lie 2: Dead Deals Staying Alive
Every pipeline has deals that should be closed-lost or moved to a long-term nurture but remain in active stages because closing them out would hurt a rep's pipeline number and trigger uncomfortable conversations with their manager.
Dead deals are the silent inflators of pipeline coverage ratios. A deal that has had no meaningful buyer engagement in 45 days is not in a 3x pipeline. It is dead weight that makes the pipeline look larger than it is while consuming rep attention and management time. Regular pipeline hygiene that flags and removes deals without recent verified buyer engagement is the most direct way to make your pipeline coverage ratio tell the truth.
Lie 3: Slippage Without Consequence
Slippage is when a deal's expected close date is pushed to a later period without a corresponding update to the deal's stage or probability. Most CRMs allow unlimited slippage with no friction. A deal can close "next quarter" indefinitely without anyone questioning whether it should still be in the pipeline at all.
Slippage above 15 to 20 percent of your active pipeline value in any given month is a signal that your close date discipline has broken down and your forecast will miss. Tracking slippage rate as a primary pipeline metric, not a secondary footnote, is what separates teams with accurate forecasts from teams that are always surprised by quarter-end results.
Six Sales Pipeline Metrics That Reveal True Pipeline Health
Most pipeline reviews track pipeline value and deal count. These two numbers tell you almost nothing about whether you are going to hit your number. The metrics that actually reveal sales pipeline health are the six that measure movement, conversion, and velocity rather than volume.
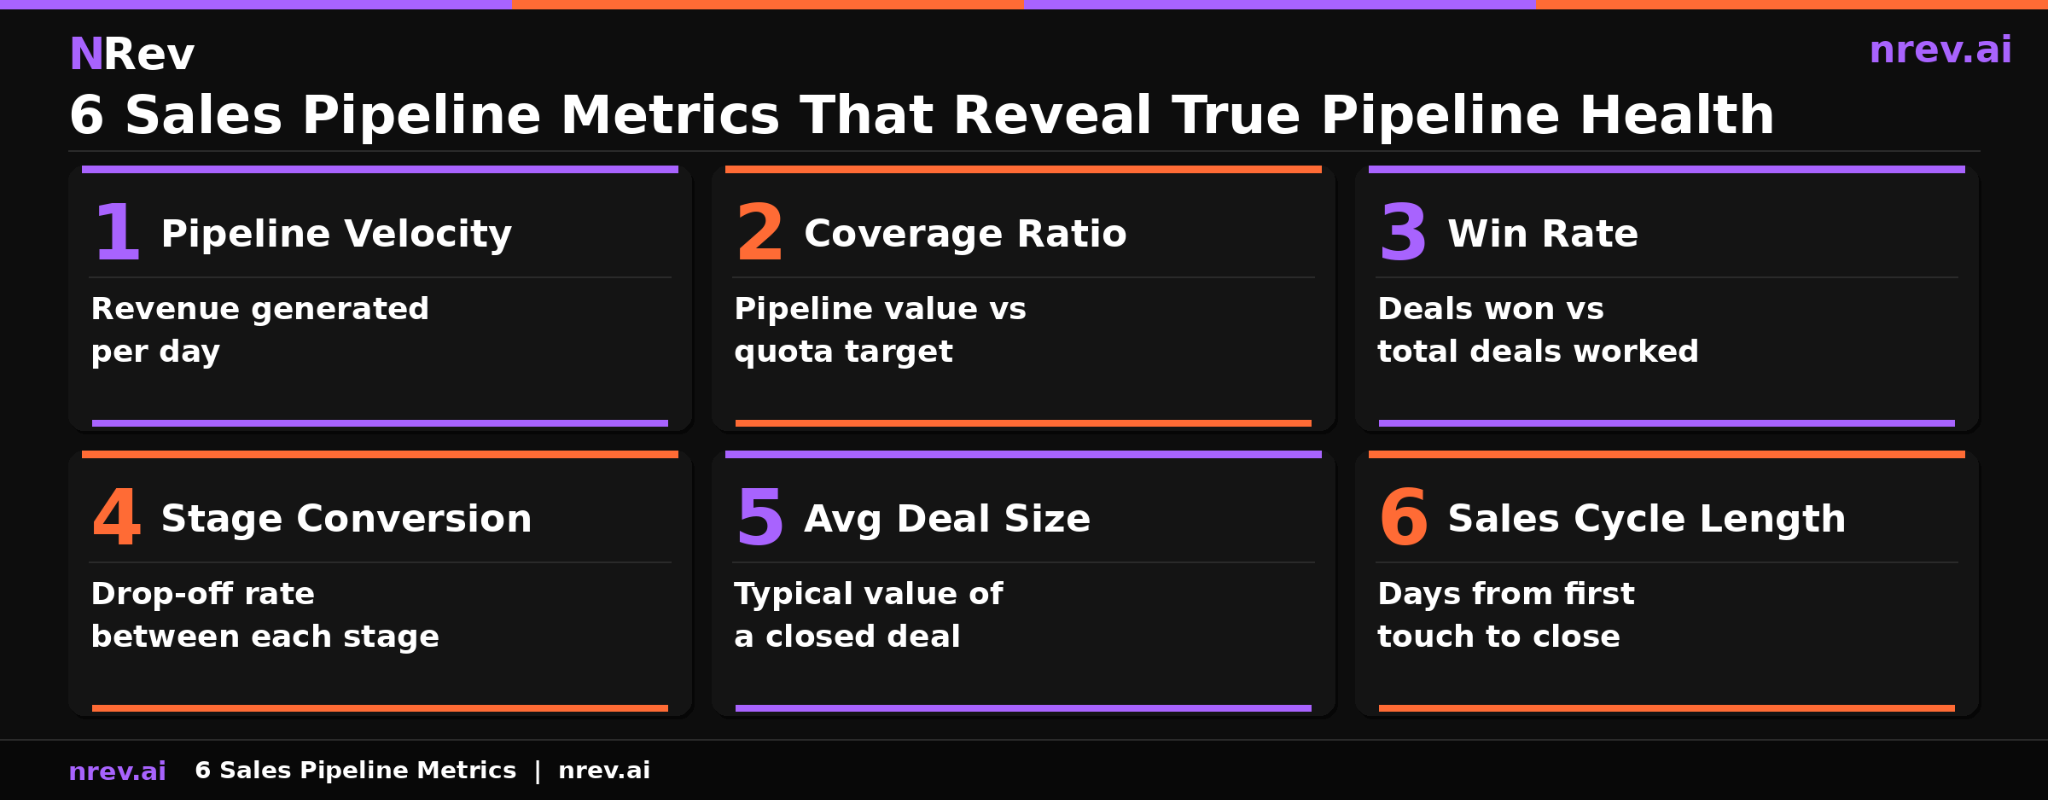
Metric 1: Pipeline Velocity
Pipeline velocity measures how much revenue your pipeline generates per day. The formula combines your number of active opportunities, average deal size, win rate, and average sales cycle length into a single dollar-per-day figure. Pipeline velocity: (Number of Deals × Average Deal Size × Win Rate) divided by Average Sales Cycle in Days.
When pipeline velocity drops, it means deals are moving more slowly, win rates are falling, average deal sizes are declining, or some combination of all three. A falling velocity number gives you weeks of advance warning that your quarter is at risk, while a simple pipeline value number might still look healthy on paper.
Metric 2: Pipeline Coverage Ratio
The coverage ratio measures the total value of your pipeline against your quota target. A 3x coverage ratio means you have three times your quota target in active opportunities. The commonly cited healthy range is 3x to 5x, though this varies meaningfully by average sales cycle length and win rate.
The important nuance is that coverage ratio is only meaningful when dead deals have been removed. A 4x coverage ratio built from 40 percent dead deals is really a 2.4x coverage ratio from live opportunities. Always calculate coverage ratio on active, qualified, recently-engaged pipeline rather than total open opportunities.
Metric 3: Win Rate
Win rate is the percentage of opportunities your team converts to closed-won. According to HubSpot's State of Sales 2024, cited by Wave Connect's B2B sales statistics which names HubSpot State of Sales 2024 as the root source, the average B2B win rate across all pipeline stages is approximately 21 percent. Root source: HubSpot State of Sales 2024. Top-performing teams reach 30 percent or higher.
Track win rate by rep, by deal source, by ICP segment, and by deal size range. Overall win rate is a lagging indicator that tells you what happened. Segmented win rate tells you where to invest and where to pull back. A rep with a 35 percent win rate on inbound deals and a 12 percent win rate on outbound deals needs a different conversation than their overall 23 percent would suggest.
Metric 4: Stage-by-Stage Conversion Rate
Stage conversion rate measures the percentage of deals that advance from each stage to the next. This is the most diagnostic metric in sales pipeline analysis because it tells you exactly where in your sales process deals are falling out.
If you consistently lose 60 percent of deals between Discovery and Proposal, your qualification criteria are too loose: you are advancing deals that are not ready. If you lose 50 percent between Proposal and Negotiation, your proposal is not compelling enough or you are not building the right stakeholder relationships during the middle stages. Stage conversion tells you where to focus improvement effort rather than asking reps to work harder everywhere simultaneously.
Metric 5: Average Deal Size
Average deal size tells you the typical revenue value of a closed deal and affects every other pipeline calculation. A 5 percent increase in average deal size produces more revenue per won deal than the same 5 percent improvement in win rate at lower deal sizes.
Track average deal size by segment, by deal source, and over time. If your average deal size is falling quarter over quarter, you are either attracting smaller buyers, losing bigger deals at a higher rate, or discounting more heavily. Each of these has a different fix.
Metric 6: Sales Cycle Length
Average sales cycle length tells you how many days it typically takes to move a deal from first qualified contact to closed-won. According to Gradient Works 2025 B2B Sales Performance Benchmarks, which aggregates data from Ebsta, Pavilion, and Norwest's benchmark reports, the average B2B sales cycle has expanded to approximately 6.5 months in 2025, up from 4.9 months in 2019. Root source: Ebsta x Pavilion 2025 GTM Benchmarks.
Sales cycle length directly affects your pipeline velocity calculation and your close date accuracy. If your average cycle is 6.5 months and you have deals with a 30-day close date that entered the pipeline 60 days ago, those close dates are almost certainly wrong.
How to Calculate Pipeline Conversion Rate at Each Stage
Pipeline conversion rate is the percentage of deals that advance from one stage to the next in your sales process. Calculating it correctly gives you the clearest possible view of where your pipeline analysis should focus.
The calculation
Stage conversion rate: (Number of Deals That Advanced to the Next Stage in a Given Period) divided by (Total Deals That Were in the Current Stage at the Start of That Period) multiplied by 100.
For example, if you had 80 deals in the Discovery stage at the start of the month and 32 of them advanced to the Proposal stage by the end of the month, your Discovery-to-Proposal conversion rate is 40 percent.
Applying conversion rate to forecast
You can use historical stage conversion rates to build a bottoms-up forecast that is far more reliable than close date multiplication. Take the number of deals in each stage, multiply by the historical conversion rate from that stage to closed-won, and multiply by average deal size. This produces an expected revenue figure for each stage cohort that does not depend on rep-reported close dates at all.
A deal in Discovery with a 3-month-old history in your CRM and a historical Discovery-to-Close conversion rate of 18 percent should be weighted very differently than a deal in Negotiation with documented budget confirmation and a signed NDA. Stage-weighted forecasting produces significantly more accurate predictions than stage-probability assumptions that treat every deal in a stage the same.
Benchmarks by stage
Based on MarketJoy's B2B pipeline conversion benchmarks, a healthy B2B pipeline typically converts at approximately 15 percent from MQL to SQL and 6 to 9 percent from SQL to closed-won. Middle-of-funnel stages typically see 10 to 20 percent conversion, while bottom-of-funnel opportunity-to-close averages 20 to 30 percent across industries. Use these as directional targets and compare them to your own historical rates to identify where your specific process has gaps.
What Healthy Sales Pipeline Health Looks Like: Benchmarks
Sales pipeline health is the aggregate measure of whether your pipeline will actually convert to revenue at the volume and speed you need. Here are the specific benchmarks that indicate a healthy pipeline versus one that requires intervention.
Coverage Ratio Benchmark: 3x to 5x quota in active, qualified pipeline. Below 3x is a capacity crisis. Above 5x either indicates a problem with dead deal hygiene or a sales process that is too early-stage heavy and lacks bottom-funnel momentum.
Win Rate Benchmark: Top-performing B2B teams reach 25 to 30 percent win rate or higher. The industry average sits at approximately 21 percent. Teams consistently below 15 percent have a qualification problem: they are advancing deals that do not match their ICP or have not confirmed the core criteria that predict a win.
Slippage Rate Benchmark: Green is below 15 percent, yellow is 15 to 30 percent, and red is above 30 percent. Slippage above 30 percent means your close date discipline has broken down entirely and your quarter-end forecast will be significantly worse than your current pipeline report suggests.
Average Deal Age Benchmark: Any deal that has been in your pipeline for more than 1.5 times your average sales cycle without advancing stages should be flagged for review. These deals are either stuck, dead, or misrepresented. Allowing them to age indefinitely in active pipeline inflates your numbers and wastes rep attention.
Forecast Accuracy Target: Best-in-class organizations achieve forecast accuracy within 5 percent of actual revenue. Most teams land between 55 to 75 percent accuracy, according to data cited by Spotlight AI's forecasting research. The gap is closed by improving data integrity, not by hoping for better CRM adoption.
This is where a connection to clean pipeline input matters enormously. Every b2b buying signal that enters your pipeline through a visitor identification or intent-triggered outreach sequence comes in with more context than a cold outbound contact, and that context improves both qualification accuracy and forecast reliability from the first stage.
How to Run a Weekly Pipeline Analysis That Actually Changes Behavior
Pipeline analysis is only valuable when it changes what your team does next. A pipeline review that ends with everyone agreeing the numbers look fine produces nothing. A pipeline review structured around the specific metrics above produces coaching conversations, deal rescues, and earlier identification of at-risk quarters.
Weekly cadence: Deal-level review
Each week, the pipeline review should examine every deal that has not had a verified buyer engagement in the past 14 days. Not a rep activity: a documented buyer response, a confirmed meeting, or a clear next step that the buyer agreed to. Deals without verified buyer engagement in 14 days should be either re-engaged with an escalation outreach or moved to a late-stage nurture queue.
For each deal with recent engagement, the review should verify: Is the stage still accurate based on where the buyer confirmed they are? Is the close date realistic based on the current stage and average sales cycle length? Are there at least two confirmed contacts in the buying committee? Single-threaded deals close at significantly lower rates than multi-stakeholder opportunities.
Monthly cadence: Metrics trend review
Monthly, track your six core pipeline metrics against the previous three months and against your benchmarks. Falling pipeline velocity is the most important leading indicator: it appears four to eight weeks before a shortfall shows up in your revenue. A coverage ratio trend falling below 3x gives you time to increase outbound activity before the gap becomes unrecoverable. A rising slippage rate signals a close date discipline problem that needs a process fix, not a coaching conversation.
Quarterly cadence: Stage conversion audit
Each quarter, run a full stage conversion audit for the previous 90 days. Where are deals falling out of your pipeline? If stage conversion between Discovery and Proposal has fallen from 45 percent to 28 percent over two quarters, something changed in your qualification criteria, your messaging, or your target market. This audit produces the input for meaningful sales process improvement rather than generic coaching.
Pipeline Analytics: Connecting Data to Revenue Action
Pipeline analytics is the layer that transforms raw pipeline data into decisions your team can act on immediately. The distinction between a pipeline dashboard and pipeline analytics is the difference between seeing a number and knowing what to do about it.
Most pipeline dashboards show you where deals are. Pipeline analytics shows you where deals are going, where they are about to fall out, and what actions change the outcome. This requires three things: clean stage-level data based on verified buyer actions, historical conversion rates that reflect your specific sales process, and a decision framework that tells each stakeholder what to do when a metric falls outside its healthy range.
For RevOps teams managing crm data quality, the pipeline analytics challenge is upstream from the analysis itself. If the data entering the pipeline is inaccurate, the analysis will produce inaccurate recommendations regardless of how sophisticated the analytics tool is. Clean data is the prerequisite, not a nice-to-have.
For outbound sales automation teams building pipelines from signal-triggered outreach, the analysis insight is different. Deals sourced from intent-signal outreach, where an account was already researching your category before first contact, consistently show higher stage conversion rates and shorter sales cycles than deals sourced from cold outbound. Tracking these conversion rates by source gives your team a clear picture of where to invest prospecting effort.
How nRev AI Feeds Accurate Data Into Your Pipeline
The quality of your sales pipeline analysis is ultimately determined by the quality of what enters your pipeline in the first place. Deals that enter with strong buying intent signals, verified contact information, and documented context from the first outreach are easier to forecast accurately than cold outbound contacts with minimal qualification context.
nRev AI monitors your target accounts across buying signals: website visitor behavior, third-party intent data, funding announcements, executive hires, and job postings that indicate a buying need. When a high-intent signal fires, nRev identifies the right contact, builds the personalized first-touch outreach, and routes it to the right rep with full context documented.
The deals that result from intent-triggered outreach arrive in your pipeline already contextualized: the account was actively researching, the contact matches your ICP, and the outreach referenced a specific verified signal. This context is captured in the CRM record from day one, giving your pipeline analysis a more reliable data point at every stage.
Your pipeline numbers can only be as honest as the data that builds them. nRev ensures the top of your pipeline is filled with qualified, contextualized opportunities rather than cold contacts that inflate your coverage ratio while pulling down your win rate.
Stop Forecasting From Fiction. Start Analyzing Pipeline That Tells the Truth.
A pipeline full of inflated stages, dead deals, and slipped close dates is not a pipeline. It is a liability dressed up as an asset. Fixing your sales pipeline analysis means fixing the data that feeds it.
nRev AI fills your pipeline from verified intent signals, documents the context behind every opportunity, and routes deals to the right rep with the information your team needs to move them forward accurately. You describe the workflow. nRev runs it.
Build your first intent-triggered pipeline workflow on nRev AI and start forecasting from data that reflects reality, not wishful thinking.